Trace every request, to every provider
OpenTelemetry traces, Prometheus metrics, channel health history, and an immutable audit log. Plug into your existing stack — no proprietary dashboard, no vendor lock-in.
Visibility into the full request path
From the first byte hitting the gateway to the upstream's streaming response — every hop is traced and every error is correlated with a trace_id you can drop into Jaeger.
OTel traces
Every request carries a trace_id. Span tree covers TenantResolve → TokenAuth → QuotaCheck → ChannelSelect → Billing → Upstream → Settle. Pipe to Jaeger / Tempo / Honeycomb.
Prometheus metrics
soxai_request_total / soxai_request_duration_ms / soxai_ttft_ms / soxai_channel_health / soxai_quota_exceeded_total — all labeled by tenant, model, channel. Drop into Grafana.
TTFT per channel
First-token latency tracked separately from total request duration. Identify which upstream is slow at streaming start, even if total throughput looks fine.
Channel health dashboard
Live 0-100 health score per channel with delta history (success / failure / throttled / auth-failure). See which provider degraded 20 minutes ago without grepping logs.
Suspended channels
Auto-suspended channels show last error + retry countdown. Operator can manually restore or extend the suspension. Probe history visible in one click.
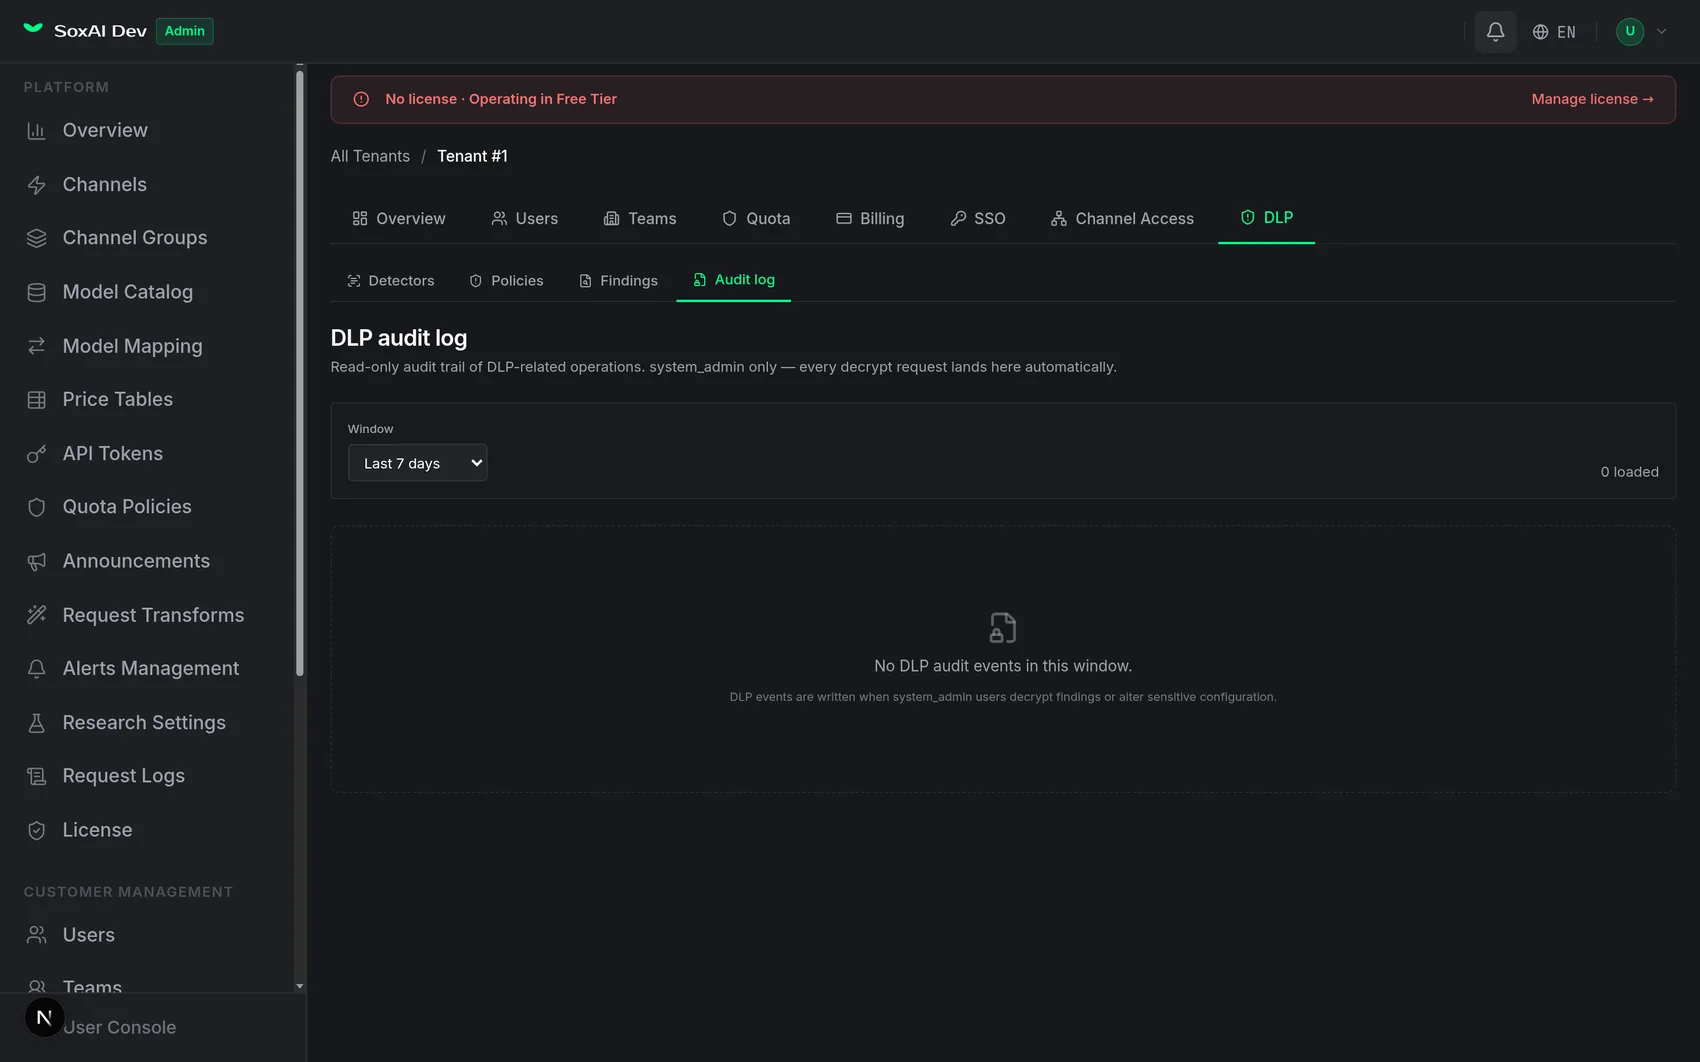
Audit log console
Filter audit_logs by event (DLP decrypt, channel suspend, role change, key rotation). Time window + scope_type filter + cursor pagination. Export to CSV.
Per-request audit
Every request_logs row has model + tokens (in/out) + cost + status + trace_id. Click a daily ledger row in the billing UI to expand into the underlying requests.
Alerts & webhooks
Channel suspension events fire to your webhook receiver. Plug into PagerDuty, Slack, or your incident pipeline. Alert engine is configurable per tenant.
Prometheus metrics, ready to scrape
All metrics labeled with tenant_id / model / channel for multi-tenant slicing.
Self-host? Same metrics, your Prometheus, your Grafana.
Every sensitive operation, queryable
system_admin-only console for auditing DLP decrypts, key rotations, channel suspensions, role changes. Filter by event + time window. Export to CSV.